Thứ Năm, 24 tháng 10, 2013

What are Core Dumps?

What are Core Dumps?

Core dumps are files the system creates when a process running in memory does not finish. The portion of memory that the process was using is then dumped to a file. This can be quite helpful when debugging your scripts. Core dumps typically have a file name like: core.5876
Reviewing Core Dump Files on VPS or Dedicated Servers

For most users, getting usable information from a core dump file can be difficult. If you are a VPS or Dedicated customer with command line (shell) access, most of the information in the core dump can be found by running either one of these two commands:

gbd -c core.####

strings core.####
Reviewing Core Dump Files on Shared Servers

If you are on a shared hosting package, for security reasons you do not have access to the command line. For our shared customers, we've created a basic PHP script that uses the commands above to allow you to find any core dump files in your account. The script can be found here:

http://inmotionhosting.com/support/files/scripts/coredumpcheck.txt

    Upload the coredumpcheck.txt file to the folder where you want to view core dumps.
    Rename the file to coredumpcheck.php
    Access coredumpcheck.php file in your browser. For example, if you have core dumps in your public_html folder then you would go to http://yourdomain.com/coredumpcheck.php
    The script will list all the core dumps in the current directory. Click any of the file names to view more details about the core dump.
    Look under the "RUNNING: gdb -c core.30387" heading to find the script that is causing the problem. It will look something like:

    Core was generated by '/usr/bin/php /home/training/public_html/t2c_escalation/escalatet2s.php'.


Resolving Core Dumps

Core dumps are advanced in nature. It's best practice to contact your web developer with the information that you have using the coredumpcheck.php script. If you are using a CMS such as WordPress, Joomla, or Drupal and the core dump is being caused by a plugin or module, your can disable or remove that module to resolve the issue.
Read More

Thứ Hai, 1 tháng 7, 2013

Locations of Common Log Files on cPanel Servers

Locations of Common Log Files on cPanel Servers


service (daemon) name error log location notes
apache web server (httpd) /usr/local/apache/logs/error_log details errors encountered during apache requests.
bind nameserver (named) /var/log/messages
proftp server (proftpd) /var/log/messages
pure-ftp server (pureftpd) /var/log/messages
exim mail transfer agent (exim) /var/log/exim_mainlog details all exim transactions.
exim mail transfer agent (exim) /var/log/exim_rejectlog details rejected messages and reasons.
exim mail transfer agent (exim) /var/log/exim_paniclog details configuration and similar errors.


courier pop3/imap service (imapd) /var/log/maillog
dovecot pop3/imap service (imapd) /var/log/maillog
mysql database server (mysqld) /var/lib/mysql/hostname.err substitute hostname with your server's hostname.

(in freebsd: /var/db/mysql/hostname.err )
openssh secure shell service (sshd) /var/log/messages, log location depends on the configuration of the syslog service.

/var/log/secure, or

/var/log/auth

Apache

Apache is the web server that is typically utilized by cPanel.  On cPanel servers Apache does write to a rather high number of logs as each site has its own traffic log.

    /usr/local/apache/logs/access_log

The access_log is used to log all http requests to ether the hostname of the server, requests directed at the servers IPs, or sites that resolve to the server but are no longer hosted on it.

    /usr/local/apache/logs/error_log

On cPanel servers all Apache errors, regardless of site, are logged in the error_log.

    /usr/local/apache/domlogs

Within the domlogs folder each site on the server will have its own log file.  These files will be the fully qualified domain name for the domain, ie domain.com, liquidweb.com.  All http traffic to a site will be logged in this log file.

Exim

Exim is the MTA(Mail Transfer Agent) that cPanel utilizes.  Exim has three primary logs, but only two of these logs contain useful information

    /var/log/exim_mainlog

The exim_mainlog contains ALL interactions that exim handles, so both incoming and outgoing mail transactions.

    /var/log/exim_rejectlog

The exim_rejectlog contains all connection attempts that were denied.  This information is also logged in the exim_mainlog.

For more information on Exim’s logs try a Google search for “Exim Cheat Sheet”.

cPanel

Cpanel does log all http traffic to WHM, webmail, and cPanel access.  All cPanel logs are located in the /usr/local/cpanel/logs directory.

    /usr/local/cpanel/logs/access_log

This access_log contains all traffic to WHM, cPanel, and webmail over http.

    /usr/local/cpanel/logs/error_log

This error_log contains all errors that occur when accessing a cPanel related site over http or https.
FTP

Regardless of FTP deamon in use, cPanel does log connections, uploads, and downloads.  However, FTP does not have its own log file it is instead threaded into the systemside messages log file.

    /var/log/messages

All FTP transactions are recorded in messages.  They are however interwoven with all over system messages that are logged in this file.

===
Read More

Thứ Năm, 30 tháng 5, 2013

PHP FCGI


A default installation of FastCGI on cPanel server is dangerously simple. It’s dangerous because one cPanel account (or one vhost) is capable of crashing down a whole server if, say, traffic were to spike up. It’s also simple because it won’t allow complex scripts to run cleanly. In brief, it’s absolutely not ready for production as-is. In this post, I’ll go over what it takes to configure FastCGI on a cPanel node properly.
The following is a list of settings that you need to add to /etc/httpd/conf/php.conf upon switching to FastCGI:
MaxRequestsPerProcess 1000
FcgidMaxProcesses 200
FcgidProcessLifeTime 7200
MaxProcessCount 500
FcgidIOTimeout 400
FcgidIdleTimeout 600
FcgidIdleScanInterval 90
FcgidBusyTimeout 300
FcgidBusyScanInterval 80
ErrorScanInterval 3
ZombieScanInterval 3
DefaultMinClassProcessCount 0
DefaultMaxClassProcessCount 3
MaxRequestLen 20468982
You’re more likely to adjust the settings in bold above. DefaultMinClassProcessCount 0 instructs FastCGI to keep zero PHP processes running for user when traffic is idle (cPanel account user) . On the other hand, DefaultMaxClassProcessCount 3 tells FastCGI to never allow more than 3 PHP processes running at a time. This settings prevents one users from crashing the server were they to receive a lot of traffic.
So go ahead and copy/paste the above into your httpd.conf and restart Apache (service httpd restart). You’re good to go now!
Distill and rebuild Apache, then restart Apache
root@server[#] /usr/local/cpanel/bin/apache_conf_distiller --update
root@server[#] /scripts/rebuildhttpdconf
root@server[#] /etc/init.d/httpd restart

/etc/httpd/conf/php.conf

# Fastcgi configuration for PHP5
LoadModule fcgid_module modules/mod_fcgid.so
MaxRequestsPerProcess 500
DefaultMinClassProcessCount 0
DefaultMaxClassProcessCount 2
MaxRequestLen 204689820
FcgidConnectTimeout 150
FcgidIdleScanInterval 90
FcgidIOTimeout 150
AddHandler fcgid-script .php5 .php4 .php .php3 .php2 .phtml
FCGIWrapper /usr/local/cpanel/cgi-sys/php5 .php5
FCGIWrapper /usr/local/cpanel/cgi-sys/php5 .php4
FCGIWrapper /usr/local/cpanel/cgi-sys/php5 .php
FCGIWrapper /usr/local/cpanel/cgi-sys/php5 .php3
FCGIWrapper /usr/local/cpanel/cgi-sys/php5 .php2
FCGIWrapper /usr/local/cpanel/cgi-sys/php5 .phtml
Read More

Chủ Nhật, 19 tháng 5, 2013

How to install Linux Malware Detect (LMD)

How to install Linux Malware Detect (LMD)


Maldet also known as Linux Malware Detect virus scanner for Linux.

Download the tar file using the below link:

    wget http://www.rfxn.com/downloads/maldetect-current.tar.gz

Extract the file using the below command

    tar -xzf maldetect-current.tar.gz

go to the maldet folder

    cd maldetect-*

Now, run the below command to install maldet.

    sh ./install.sh or sudo sh ./install.sh

It will give below output

    Linux Malware Detect v1.3.4
    (C) 1999-2010, R-fx Networks <proj@r-fx.org>
    (C) 2010, Ryan MacDonald <ryan@r-fx.org>
    inotifywait (C) 2007, Rohan McGovern <rohan@mcgovern.id.au>
    This program may be freely redistributed under the terms of the GNU GPL

    installation completed to /usr/local/maldetect
    config file: /usr/local/maldetect/conf.maldet
    exec file: /usr/local/maldetect/maldet
    exec link: /usr/local/sbin/maldet
    cron.daily: /etc/cron.daily/maldet

    maldet(32517): {sigup} performing signature update check…
    maldet(32517): {sigup} local signature set is version 2010051510029
    maldet(32517): {sigup} latest signature set already installed


To update the maldet use the below commands.

    maldet –update-ver

    maldet –update[/i]

To scan the files.

    maldet -a /home/username/

It will scan all the files and provide you the output.


To scan all user uder public_html paths under /home*/ this can be done with:

    root@server[~]# maldet –scan-all /home?/?/public_html

To scan the same path but the content that has been created/modified in the last 5 days:

    root@server[~]# maldet –scan-recent /home?/?/public_html 5

To scan but forget to turn on the quarantine option, you could quarantine all malware results from a previous scan with:

    root@server[~]# maldet –quarantine SCANID

If you wanted to attempt a clean on all malware results from a previous scan that did not have the feature enabled, you would do with.

    root@server[~]# maldet –clean SCANID

If you had a file that was quarantined from a false positive or that you simply want to restore (i.e: you manually cleaned it), you can use the following:

    root@server[~]# maldet –restore config.php.2384
    root@server[~]# maldet –restore /usr/local/maldetect/quarantine/config.php.2384

 
Read More

Thứ Ba, 14 tháng 5, 2013

How to enable Custom php.ini for PHP FCGI

If you want to enable custom php.ini settings for PHP FCGI on your server then follow the below steps : 

1 > Create a .htaccess file under the directory : /home/username/public_html
root@server[#] cd /home/username/public_html
root@server[/home/username/public_html]# vi .htaccess

And the below two lines at the top :
AddHandler php5-fastcgi .php
Action php5-fastcgi /cgi-bin/php.fcgi

save and quit.
2 > go to the cgi-bin directory : /home/username/public_html/cgi-bin
root@server[#] cd /home/username/public-html/cgi-bin
and then copy the default php.ini here
root@server[#] cp /usr/local/lib/php.ini /home/username/public_html/cgi-bin/
3 > Create php.fcgi file to load custom php.ini
Please note that you should still be in /home/username/public_html/cgi-bin location.
root@server[/home/username/public_html/cgi-bin] # vi php.fcgi
and then add the below code :
#!/bin/sh
export PHP_FCGI_CHILDREN=1
export PHP_FCGI_MAX_REQUESTS=10
exec /usr/local/cpanel/cgi-sys/php5

save and quit.
Now make the file php.cgi executable:
root@server[/home/username/public_html/cgi-bin] # chmod + x php.fcgi
4 > Change ownership of files to correct user:
root@server[/home/username/public_html/cgi-bin] chown username.username * -R
And if it still does not work for you then follow the below steps as well :
5 > Add paths to php.conf file
root@server[#] vi /usr/local/apache/conf/php.conf
and add the below lines :
Action php5-fastcgi /cgi-bin/php.fcgi
AddType application/x-httpd-php .php

save and quit.
and after adding the above two lines the php.conf file should look like this :
root@server[/usr/local/apache/conf] # cat php.conf
# Fastcgi configuration for PHP5
LoadModule fcgid_module modules/mod_fcgid.so
MaxRequestsPerProcess 500
AddHandler fcgid-script .php5 .php4 .php .php3 .php2 .phtml
Action php5-fastcgi /cgi-bin/php.fcgi
AddType application/x-httpd-php .php
FCGIWrapper /usr/local/cpanel/cgi-sys/php5 .php5
FCGIWrapper /usr/local/cpanel/cgi-sys/php5 .php4
FCGIWrapper /usr/local/cpanel/cgi-sys/php5 .php
FCGIWrapper /usr/local/cpanel/cgi-sys/php5 .php3
FCGIWrapper /usr/local/cpanel/cgi-sys/php5 .php2
FCGIWrapper /usr/local/cpanel/cgi-sys/php5 .phtml

# End of autogenerated PHP configuration.
6 > Distill and rebuild Apache, then restart Apache
root@server[#] /usr/local/cpanel/bin/apache_conf_distiller –update
root@server[#] /scripts/rebuildhttpdconf
root@server[#] /etc/init.d/httpd restart
And finally to test if the custom php.ini is working follow the steps :

root@server[#] cd /home/username/public_html
root@server[/home/username/public_html]# vi info.php
Add the below lines :
< ?php
phpinfo();
?>

save and quit.
Change the ownership of info.php file to user:user
root@server[/home/username/public_html]# chown username:username info.php
Now browse the URL : http://domain.com/info.php
And search for the line : Loaded Configuration File
Loaded Configuration File /home/username/public_html/cgi-bin/php.ini

Or
Here's a simpler solution:

Edit the file called /usr/local/cpanel/cgi-sys/php5 -- insert the line above exec /usr/bin/php as follows:


Code:
#!/bin/sh

# If you customize the contents of this wrapper script, place
# a copy at /var/cpanel/conf/apache/wrappers/php5
# so that it will be reinstalled when Apache is updated or the
# PHP handler configuration is changed

[ -f ~/php.ini ] && exec /usr/bin/php -c ~/
exec /usr/bin/php 

Copy the file over to /var/cpanel/conf/apache/wrappers/php5 as indicated at the top of the file.

Now, if any account has a php.ini file in their home directory (not public_html) then it will be used instead of the system-provided one.
Read More

Thứ Tư, 8 tháng 5, 2013

Chuyển Database SQL Server sang máy khác (Backup and Restore MSSQL)

Chuyển Database SQL Server sang máy khác (Backup and Restore MSSQL)

Lưu ý : Các cách sau đây đều sử dụng SQL Server Management Studio

Cách 1: đơn giản nhất là Backup từ máy mình rồi Restore lại khi sang máy khác.

Click chuột phải vào Database rồi chọn Tasks >> Backup


Ở máy kia, tạo một Database mới sau đó click chuột phải vào Database mới đó chọn Tasks >> Restore >> Database


Nhấn vào From device và Add đường dẫn đến file backup


Click chọn tên file vừa Add và nhấn OK


Cách 2: Generate Script Database

Click chuột phải vào Database chọn Tasks >> Generate Scripts


 Nhấn Next cho đến bước Set Scripting Options, Nếu bạn chỉ muốn sao chép cấu trúc Database (gồm các Table, SP, Function, ..) mà không gồm dữ liệu trong các Table thì tiếp tục nhấn Next, nếu muốn sao chép cả dữ liệu thì Click vào Advanced


Trong Option Types of data  to script chọn Schema and data


Sau đó bạn sẽ được 1 file dạng .sql, mang file này sang máy khác chỉ cần kéo file vào SQL Server Management Studio và nhấn Execute để tạo Database.


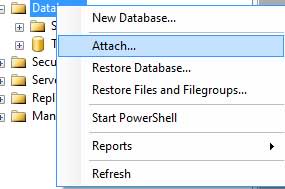
 Cách 3: Copy file Database .mdf rồi Attach lại ở máy khác


Trong 3 cách trên, tôi thường dùng cách 2 nhất, do nếu bạn dùng các phiên bản SQL Server không đồng nhất ở các máy thì cũng không bị lỗi, cách 1 và 3 nếu SQL Server ở máy tạo Database có phiên bản cao hơn máy khác thì khi add vào sẽ không được. Cách 1 thường được dùng nếu bạn lập trình Web do trên Hosting bạn chỉ có thể chọn Restore. 

Read More

Chủ Nhật, 5 tháng 5, 2013

Login to Joomla Administrator Not Working and No Error Is Displayed

Login to Joomla Administrator Not Working and No Error Is Displayed


Yesterday we had a client that told us that he was unable to login to his Joomla website. He told us that everytime he tries to login, he gets redirected back to the login page with no error! Since he was a technical person, he told us that he did a research on the subject and the thinks that it’s the session.savepath Joomla problem. This made sense because Joomla uses the built-in PHP $_SESSION superglobal variable to maintain information about the logged in person and if it can’t save that information to the session, then it won’t be able to login the person.

So, the first thing we tried to do was to check whether sessions were actually working on the site, and they were (we set a session variable in one page and we retrieved in another page) – so that takes care of our client’s theory of why the problem is happening.

Our second attempt was to check the ACL (Access Control List) of the website as this problem is often associated with incorrect ACL. So we logged in to phpMyAdmin, we selected the database of his Joomla website, and we checked it and it was all clean: the tables jos_users, jos_usergroups, jos_user_usergroup_map, and jos_viewlevels were all OK. We then checked the specific entries in the table jos_assets that might affect the login process, and all these entries were fine.

We then tried to do things a bit differently, since our customer was a technical person, he made a backup for the website (the backup consisted of the filesystem and the database) before the problem happened and immediately after the problem happened. So, what we did was that we extracted the database from both backups and started comparing the database of the working website with that of the non-working website. There were about 20 differences – all of them were trivial, with the exception of a very small difference in one of the INSERT lines (the difference is in red):

INSERT line in the working version:

INSERT INTO `jos25_extensions` (`extension_id`, `name`, `type`, `element`, `folder`, `client_id`, `enabled`, `access`, `protected`, `manifest_cache`, `params`, `custom_data`, `system_data`, `checked_out`, `checked_out_time`, `ordering`, `state`) VALUES
(432, 'plg_user_joomla', 'plugin', 'joomla', 'user', 0, 1, 1, 0, '{"legacy":false,"name":"plg_user_joomla","type":"plugin","creationDate":"December 2006","author":"Joomla! Project","copyright":"(C) 2005 - 2009 Open Source Matters. All rights reserved.","authorEmail":"admin@joomla.org","authorUrl":"www.joomla.org","version":"2.5.0","description":"PLG_USER_JOOMLA_XML_DESCRIPTION","group":""}', '{"autoregister":"1"}', '', '', 0, '0000-00-00 00:00:00', 2, 0);

INSERT line in the non-working version:

INSERT INTO `jos25_extensions` (`extension_id`, `name`, `type`, `element`, `folder`, `client_id`, `enabled`, `access`, `protected`, `manifest_cache`, `params`, `custom_data`, `system_data`, `checked_out`, `checked_out_time`, `ordering`, `state`) VALUES
(432, 'plg_user_joomla', 'plugin', 'joomla', 'user', 0, 0, 1, 0, '{"legacy":false,"name":"plg_user_joomla","type":"plugin","creationDate":"December 2006","author":"Joomla! Project","copyright":"(C) 2005 - 2009 Open Source Matters. All rights reserved.","authorEmail":"admin@joomla.org","authorUrl":"www.joomla.org","version":"2.5.0","description":"PLG_USER_JOOMLA_XML_DESCRIPTION","group":""}', '{"autoregister":"1"}', '', '', 0, '0000-00-00 00:00:00', 2, 0);

As you can see, there is a “1? in the first line that is a “0? in the first line, and guess what – that was the cause of the whole problem. You see, that little 1 was telling Joomla that the user plugin was enabled and that all user activity should work normally. The 0 in the non-working version was telling Joomla to disable the user plugin, and that’s why logins where not working on the Joomla site and no errors were returned. Changing that value back to 1 fixed the whole problem.

So why did that happen?

We think that there are two reasons of why that happened:

    Someone manually disabled the user plugin on the Joomla website.

    A (badly written) extension mistakenly disabled the userplugin. Our preliminary investigation on this issue leads to believe that this extension might be the userport extension.

If you have the problem where you’re trying to login to your Joomla backend and you’re getting redirected to the login screen, and if this post did not help you (or if it’s a bit too technical for you) then all you need to do is to contact us. We will respond immediately, we will fix your website as soon as we can, and we won’t charge you much!
Read More

Change the collation on a MySQL database via PhpMyAdmin

 Change the collation on a MySQL database via PhpMyAdmin

MySQL supports different types of collation and characters sets. The following article will walk you through how to change the collation for one table or the entire database. 


Change collation for the entire database
  1. Connect to the database using phpMyAdmin
  2. Select your database and click on Operations from the top menu 
  3. On the drop down menu under collation select the character or collation that you intend to use for the database. 
  4. Click on Go and the change is effected for the entire database
Change the collation for one table
  1. Connect to the database using phpMyAdmin
  2. Select your database
  3. Select your table and click on operations from the top menu.
  4. Under the Table options menu select the collation/character for the table
  5. Click on Go to make the change for the table


Read More

Detecting DDos Attacks Using the Netstat Command


Take a look at these handy netstat commands below that will surely help you determine wether your under attack or are part of an attack.

netstat -na

Display all active Internet connections to the server and only established connections are included.

netstat -an | grep :80 | sort

Show only active Internet connections to the server on port 80 and sort the results. Useful in detecting a single flood by allowing you to recognize many connections coming from one IP.

netstat -n -p|grep SYN_REC | wc -l

To find out how many active SYNC_REC are occurring on the server. The number should be pretty low, preferably less than 5. On DoS attack incidents or mail bombs, the number can jump to pretty high. However, the value always depends on system, so a high value may be average on another server.

netstat -n -p | grep SYN_REC | sort -u

List all IP addresses involved.

netstat -n -p | grep SYN_REC | awk '{print $5}' | awk -F: '{print $1}'

List all the unique IP addresses of the nodes that are sending SYN_REC connection status.

netstat -ntu | awk '{print $5}' | cut -d: -f1 | sort | uniq -c | sort -n

Use netstat command to calculate and count the number of connections each IP address makes to the server.

netstat -anp |grep 'tcp\|udp' | awk '{print $5}' | cut -d: -f1 | sort | uniq -c | sort -n

List the number of connections the IPs are making to the server using TCP or UDP protocol.

netstat -ntu | grep ESTAB | awk '{print $5}' | cut -d: -f1 | sort | uniq -c | sort -nr

Check on ESTABLISHED connections instead of all connections, and display the number of connections for each IP.

netstat -plan|grep :80|awk {'print $5'}|cut -d: -f 1|sort|uniq -c|sort -nk 1

Show a list IP address’s and its number of connections that are connecting to port 80 on the server. Port 80 is used mainly by the HTTP protocol.


A quick and usefull command for checking if a server is under ddos is:
netstat -anp |grep 'tcp\|udp' | awk '{print $5}' | cut -d: -f1 | sort | uniq -c | sort -n
That will list the IPs taking the most amount of connections to a server. It is important to remember that the ddos is becoming more sophistcated and they are using fewer connections with more attacking ips. If this is the case you will still get low number of connections even while you are under a DDOS.
===========
Denial-of-service attack (DoS attack) or Distributed Denial-of-service attack (DDoS attack) is an attempt to make a machine or network resource unavailable to its intended users. This attack generally target sites or services hosted on high-profile web servers such as banks, credit card payment gateways, and even root nameservers. DoS attacks are implemented by either forcing the targeted computer to reset, or consuming its resources so that it can no longer provide its services or obstructs the communication media between the users and the victim so that they can no longer communicate adequately.

This blog provides you an overview on how to identify DDOS attack using netstat command.
#netstat -na
Display all active Internet connections to the server and only established connections are included.
#netstat -an | grep :80 | sort
Show only active Internet connections to the server on port 80 and sort the results. Useful in detecting a single flood by allowing you to recognize many connections coming from one IP.
#netstat -n -p|grep SYN_REC | wc -l
To find out how many active SYNC_REC are occurring on the server. The number should be pretty low, preferably less than 5. On DoS attack incidents or mail bombs, the number can jump to pretty high. However, the value always depends on system, so a high value may be average on another server.
#netstat -n -p | grep SYN_REC | sort -u
List all IP addresses involved.
#netstat -n -p | grep SYN_REC | awk ‘{print $5}’ | awk -F: ‘{print $1}’
List all the unique IP addresses of the nodes that are sending SYN_REC connection status.
#netstat -ntu | awk ‘{print $5}’ | cut -d: -f1 | sort | uniq -c | sort -n
Use netstat command to calculate and count the number of connections each IP address makes to the server.
#netstat -anp |grep ‘tcp\|udp’ | awk ‘{print $5}’ | cut -d: -f1 | sort | uniq -c | sort -n
List the number of connections the IPs are making to the server using TCP or UDP protocol.
#netstat -ntu | grep ESTAB | awk ‘{print $5}’ | cut -d: -f1 | sort | uniq -c | sort -nr
Check on ESTABLISHED connections instead of all connections, and display the number of connections for each IP.
#netstat -plan|grep :80|awk {‘print $5′}|cut -d: -f 1|sort|uniq -c|sort -nk 1
Show a list IP addresses and its number of connections that are connecting to port 80 on the server. Port 80 is used mainly by the HTTP protocol.


Read More